Mapping Chicago Crime
Chicago’s Homicides Relative to School Locations

Chicago’s Homicides Relative to School Locations
This visualization was produced to highlight the proximity between Chicago’s elementary schools and the locations of homicides around the city during 2018. We can see large clusters of violence on the South and West sides of the city which often occur on schools’ doorsteps.
You can visit this link to zoom in and out in the map: Plot.ly Map
At its heart, this is a visualization project. It leveraged api requests, pandas, caching, and culminated in the final plotly generated map.
This project makes use of two data sources. The program plots where each elementary / middle school is located within the city and then plots all reported homicides that occurred across the city throughout 2018. The plotly map also contains information about the schools “ranking” as assigned by the Chicago Public Schools District.
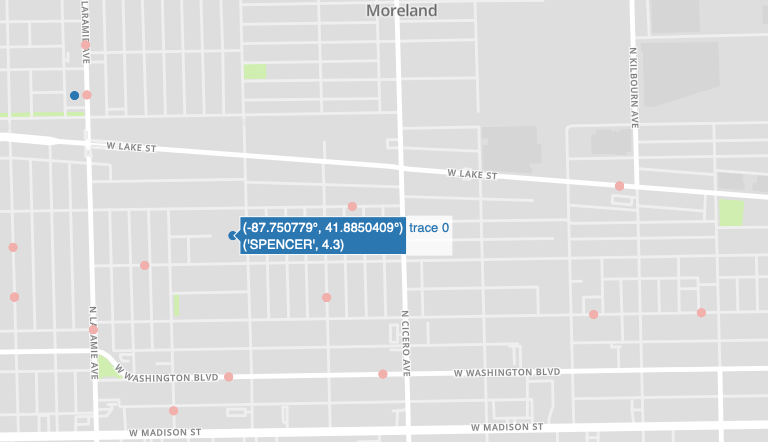
| Score | Description |
|---|---|
| 4.0 + | Level 1 + School, The highest ranking a school can get |
| 3.5 - 3.9 | Level 1 School |
| 3.0 - 3.4 | Level 2 + School, School needs to improve |
| 2.0 - 2.9 | Level 2 School, School needs to improve rapidly |
| < 2.0 | Level 3 School, Lowest ranking a school can have, at risk of being closed |
Data Sources
A large XLS file that is in the repo title “Accountability_SQRPratings_2018-2019_SchoolLevel.xls”. It contains information about every Chicago Public School within the city. The program will access an api and request information about every crime within the city for 2018 (Over 200,000 instances) and will cache this information in “2018crime.csv”.
https://data.cityofchicago.org/Public-Safety/Crimes-2001-to-present/ijzp-q8t2/data
Code
Code for this visualization is located here: https://github.com/connorlockman/chicago-schools-and-crime/blob/master/README.md
Chicago’s Homicides Relative to School Locations
This project uses exploratory data analysis to visualize underlying car crash data for Southeast Michigan. This step uses python, pandas, matplotlib, and se...
Burtin’s Antibiotic Data Visualized